In this series we will introduce the HTML canvas element and learn how to manipulate it with javascript to draw and display graphics. So i will start in this article by demonstrating the canvas and the common canvas functions .
You can think of the html <canvas> element as an area in the document that can drawn on it. Ideally this works in the same way as on programs like Paint in Windows. In order to draw, you must do this through JavaScript. Javascript provides many interfaces and functions to interact with <canvas> programmatically, starting from drawing simple shapes to animating things.
Getting Started
To start let’s create an html document and add <canvas> tag as shown and give it a width and height.
<!DOCTYPE html>
<html>
   <head>
      <meta charset="utf-8" />
      <title>HTML Canvas</title>
   </head>
   <body>
      <canvas id="myCanvas" width="400" height="400" style="border: 1px solid #ccc">
   </body>
</html>
This is a blank canvas element, the next step is to access it in javascript so we can start drawing.
const myCanvas = document.getElementById('myCanvas');

if(myCanvas.getContext) {
     let context = myCanvas.getContext('2d');
}
In this snippet using document.getElementById() to get a reference to the canvas. To start drawing a context needed, we can obtain the context with canvas.getContext() function. This function return the rendering context, for 2D rendering we pass “2d”. If you intend to work on 3D rendering we can pass “webgl” or “experimental-webgl“.
You can check for the “webgl” support in the common browsers by visiting caniuse.com
In the above example i checked for getContext() function support in the canvas instance. Then i called myCanvas.getContext(‘2d’) to retrieve the context, once retrieved we can start invoking the canvas drawing functions such as fillStyle(), fillRect() as shown below:
if(myCanvas.getContext) {
    let context = myCanvas.getContext('2d');
    context.fillStyle = 'blue';
    context.fillRect(10, 10, 100, 60);
}
The fillRect() function display a filled rectangle with specific color which means you have to use the fillStyle() function along with it to specify the color, we will talk about canvas styling in the next topic. When running this example in your browser you will see a blue rectangle in the top left right corner of the canvas.
Canvas Coordinates
The Canvas is a grid which have two axes (x, y). The origin of this grid is the top left corner which have x=0 and y=0 so all elements are positioned relative to this origin point. To understand this imagine the previous example where the rectangle being displayed relative to the top left corner, This is done using the fillRect() function above, the function accept the (x,y) position as it’s first arguments so in this case the x=10 and y=10 as shown in the below figure. All canvas drawing functions we will see later works in the same way and accept the (x,y) parameters.

Available Canvas Drawing Functions
The javascript canvas interface provides many functions for drawing the following shapes:
- Rectangles
- Lines
- Paths
- Arcs and Circles
- Text
- Images
In the next section we will look at how to draw rectangles, lines, paths, arcs and circles.
Drawing Lines
To draw a straight line we can use the moveTo(x,y), lineTo(x,y) and stroke() functions, where moveTo() specifies the starting point of the line and lineTo() specifies the ending point. The stroke() function used to draw the line.
context.moveTo(20, 20);
context.lineTo(200, 200);
context.stroke();
Drawing Paths
The path is is a group of lines connected togther. We can use paths to draw complex shapes like circles, triangles. To draw a path first we must begin the path by beginPath() function, then we can call any arbitrary drawing functions then closing the path by closePath() function, we can draw outlined paths using the stroke() function or filled path using the fill() function.
In this example we will display a stroked and filled triangle:
Stroked Triangle
context.beginPath();

context.moveTo(30, 120);
context.lineTo(120, 30);
context.lineTo(200, 120);
context.closePath();
context.stroke();
Filled Triangle
context.beginPath();

context.moveTo(30, 120);
context.lineTo(120, 30);
context.lineTo(200, 120);

context.closePath();
context.fillStyle = 'green';
context.fill();
Drawing Rectangles
To draw rectangles or squares we can use the strokeRect(x, y, width, height) or fillRect(x, y, width, height) functions. strokeRect() displays outlined rectangle in the specified position, but the fillRect() displayed filled rectangle. Both functions accept the x, y, width, height parameters.
Stroked Rectangle
context.strokeRect(200, 300, 70, 50);
Filled Rectangle using fillStyle()
context.fillStyle = 'red';
context.fillRect(300, 300, 70, 50);
To draw squares using use equal width and height.
Drawing Arcs
To draw arc or circle there are the arc() functions. The declaration of this function as follows:
- arc(x, y, radius, startAngle, endAngle, anticlockwise)
arc() takes the x,y which are the center of the arc or circle, radius which the circle radius, startAngle, endAngle, represent the start and end points of the arc in radians, anticlockwise is a boolean that draws the arc anticlockwise.
Stroked Arc
context.arc(100, 300, 30, 0, 60, 1);
context.stroke();
Filled Arc
context.arc(100, 300, 30, 0, 60, 1);
context.fill();
Stroked Circle
context.arc(100, 300, 30, 0, 380, 0);
context.stroke();
Filled Circle
context.arc(100, 300, 30, 0, 380, 0);
context.fill();
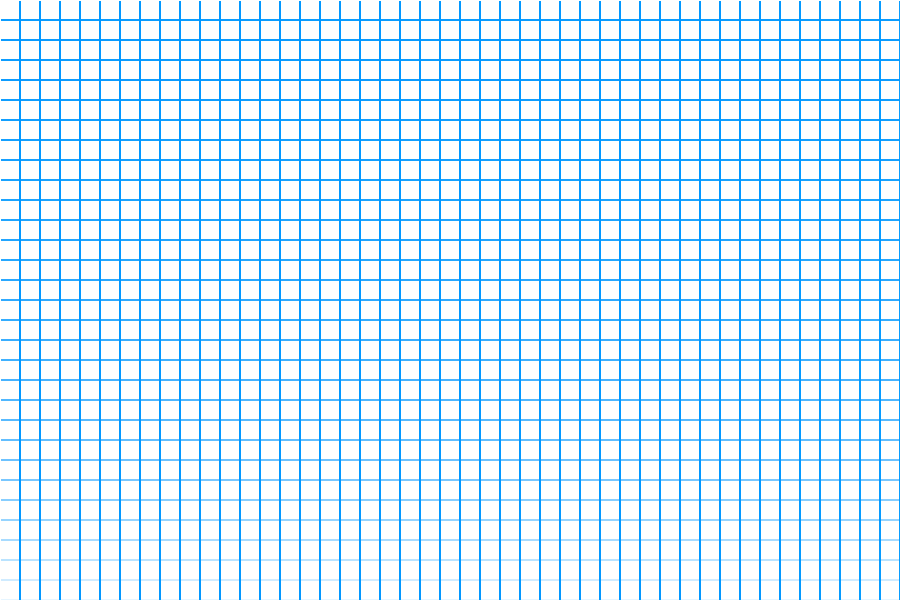
Example: Drawing grid in the canvas
<canvas width="900" height="600" id="myCanvas" style="border: 1px solid #ccc"></canvas>


  <script>
      const ctx = document.getElementById('myCanvas').getContext('2d');

      ctx.lineWidth = 0.2;
      ctx.strokeStyle = '#09f';

      let vertical_lines = [{x: 20, y: 1}];
      let horizontal_lines = [{x: 1, y: 20}];

      let vertical_increment_by = 20;
      let horizontal_increment_by = 20;

      for(let i = 0; i < ctx.canvas.width; i++) {
          if(vertical_increment_by >= ctx.canvas.width) break;

          vertical_increment_by += 20;

          vertical_lines.push({x: vertical_increment_by, y: 1});
      }

      for(let j = 0; j < ctx.canvas.height; j++) {
          if(horizontal_increment_by >= ctx.canvas.height) break;

          horizontal_increment_by += 20;

          horizontal_lines.push({x: 1, y: horizontal_increment_by});
      }

      for(let i = 0; i < vertical_lines.length; i++) {
         ctx.moveTo(vertical_lines[i].x, vertical_lines[i].y);
         ctx.lineTo(vertical_lines[i].x, ctx.canvas.height);
         ctx.stroke();
      }

      for(let j = 0; j < horizontal_lines.length; j++) {
         ctx.moveTo(horizontal_lines[j].x, horizontal_lines[j].y);
         ctx.lineTo(ctx.canvas.width, horizontal_lines[j].y);
         ctx.stroke();
      }


  </script>